Did we pay more taxes in the past?

By: Dave Roos
Members of the nurses' union, National Nurses United, march on Wall Street in June 2011 to protest income inequality. See more pictures of protests.
Spencer Platt/Getty Images

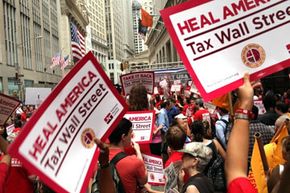
Thanks to Occupy Wall Street and frustration about the floundering economy, income inequality has become a hot topic. One source of frustration stems from the belief that the rich have gotten richer over the past few decades due to tax breaks and other loopholes designed to help them keep their money in their pockets. Has this always been the case, however? Did we -- rich and poor alike -- pay more taxes in the past? This is a fascinating and complicated question, and the answer largely depends on what numbers you use: the marginal tax rate, the effective tax rate, or the total U.S. tax burden as a percentage of gross domestic product (GDP).

Let's start with the marginal tax rate. The United States employs a progressive tax system, meaning that higher levels of income are taxed at a higher rate. For example, in 2012, the IRS taxes personal income between $0 and $8,700 at 10 percent for unmarried filers. That's called the marginal tax rate, and it increases with each tax bracket. The marginal tax rate for income over $8,700, but not over $35,350 is 15 percent. But here's the tricky part; a person who earns $35,350 doesn't owe 15 percent on all $35,350. That person owes 10 percent on the first $8,700 (=$870) and 15 percent on the remaining $27,650 (=$3,997) for a total tax bill of $4,867, or 13.7 percent of all income.

Advertisement

Why is this important to understand? Because the marginal tax rate is often used to compare today's tax rates to those of the past. Federal income tax was first collected in 1913, when all income below $435,292 (in today's dollars) was taxed at a flat 1 percent, and the highest marginal tax rate of 7 percent was reserved for income over $11.3 million [source: Tax Foundation]. Today's highest marginal tax rate is 35 percent on income over $388,350, which seems like a dramatic increase from 1913. But when you look at the entire 99-year run since 1913, today's top marginal tax rate is incredibly low. Let's look at some numbers:

  • During WWI, the top rate hovered around 73 percent, and in 1944 and 1945, the top rate peaked at 94 percent.
  • From 1950 to 1963, the top rate stuck at 91 or 92 percent.
  • From 1964 through 1981, the top rate fluctuated between 75 and 69 percent.
  • Even under Ronald Reagan, a famously anti-tax president, the top rate remained 50 percent until the final two years of his presidency, when it dipped to 28 percent, the lowest top marginal rate since the 1920s.
  • The 2014 top rate is 39.6 percent, up from 2012's 35 percent, the lowest in the past 82 years, except for 1988 through 1992 [source: Tax Foundation].

So that means we pay less money in taxes than previous generations, right? Not exactly. We'll explain why on the next page.

Advertisement

Comparing Effective Tax Rates

The top marginal tax rate, as we explained earlier, only applies to earnings above the highest income level. The real percentage that Americans pay in taxes -- called the effective tax rate -- is considerably lower than the marginal rate. In our example above, the marginal tax rate on $35,350 was 15 percent, but the effective tax rate was 13.7 percent. So how does our current effective tax rate compare to the past? As the Congressional Budget Office helps explain:

  • The total effective federal tax rate, which includes personal and corporate income tax, Social Security (payroll tax) and excise tax (taxes on certain goods like tobacco and alcohol), was 20.5 percent in 2005, the most recent year for statistics.
  • The top 1 percent of earners pays an effective tax rate of 31.2 percent and the lowest fifth of earners only pays 4.3 percent.
  • In 1979, when the top marginal tax rate was 70 percent, the total effective tax rate was 22.2 percent, only 1.7 percent higher than 2005, when the highest marginal tax rate was 35 percent -- half the 1979 rate.
  • Even though the top marginal tax rate fluctuated wildly from 1979 to 2005, the effective tax rate was never higher than 23 percent (2000) or lower than 20.1 percent (2004). And interestingly, there was only a 4.6 percent difference between the top marginal tax rates in those two years [sources: CBO and Tax Policy Center].

The lesson from those numbers is that the marginal tax rate, although an interesting reflection on how much we tax the wealthiest Americans, doesn't reflect the average amount that Americans pay in taxes. The effective tax rate is a much better indicator, as is another statistic called the total tax burden as percentage of GDP. Gross domestic product (GDP) is defined as the "output of goods and services produced by labor and property located in the United States" [source: Bureau of Economic Analysis]. GDP isn't the same as total income, but it's a reliable number we can use to compare with the total amount of revenue collected in taxes.

Advertisement

Like the effective tax rate, the total tax burden as a percentage of GDP has remained virtually unchanged over the past five decades. In 2009, when the top marginal tax rate was 35 percent, the total tax burden for U.S. taxpayers equaled 24 percent of GDP. In 1965, when the top marginal rate was 70 percent, the tax burden was 24.7 percent of GDP, almost exactly the same. The tax burden peaked in 2000 at 29.5 percent[sources: Calabresi and Tax Policy Center].

Why do we continue to pay roughly the same amount in taxes, even though the marginal tax rates have changed considerably? The best answer is that tax law is constantly changing and accountants in different decades have exploited different tax loopholes -- numerous tax breaks, credits, subsidies, deductible income and expenses -- to maintain a steady effective tax rate even as marginal rates fluctuate [source: Kocieniewski].

For lots more information on income tax and accounting, explore the related links on the next page.

Advertisement

Lots More Information

Related Articles

  • Bureau of Economic Analysis. "National Income and Product Accounts: Gross Domestic Product, 4th Quarter and Annual 2011 (Estimate)." January 27, 2012 (Feb. 12, 2012.) http://www.bea.gov/newsreleases/national/gdp/gdpnewsrelease.htm
  • Calabresi, Massimo. Time. "The Socialist Threat: Tax Day Edition." April 15, 2011 (Feb. 12, 2012.) http://swampland.time.com/2011/04/15/the-socialist-threat-tax-day-edition/
  • Congressional Budget Office. "Appendix: Detailed Tables for 1979 to 2005" (Feb. 14, 2012.) http://cbo.gov/ftpdocs/88xx/doc8885/Appendix_wtoc.pdf
  • Kocieniewski, David. The New York Times. "U.S. Business Has High Tax Rates but Pays Less." May 2, 2011 (Feb. 15, 2012.) http://www.nytimes.com/2011/05/03/business/economy/03rates.html
  • Tax Foundation. Tax Data. "U.S. Federal Income Tax Rates History, 1913-2011 (Nominal and Inflation-Adjusted Brackets)." September 9, 2011 (Feb. 12, 2012.) http://www.taxfoundation.org/taxdata/show/151.html
  • Tax Policy Center. Tax Facts. "Historical Top Tax Rate." January 31, 2011 (Feb. 12, 2012.) http://www.taxpolicycenter.org/taxfacts/displayafact.cfm?Docid=213

Advertisement

Loading...