7 Warning Signs of a Looming Recession

By: Dave Roos  | 
economic crisis
While the economy has regained full strength since the last recession ended in 2009, no one expects those gains to last forever. fotosipsak/Getty Images

The past 50 years have taught us that every heady economic high must have a soul-searching low, and recent history bears that out.

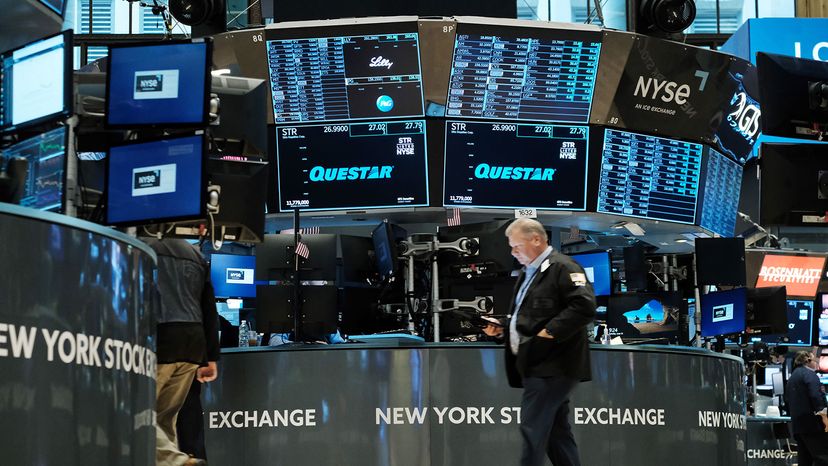
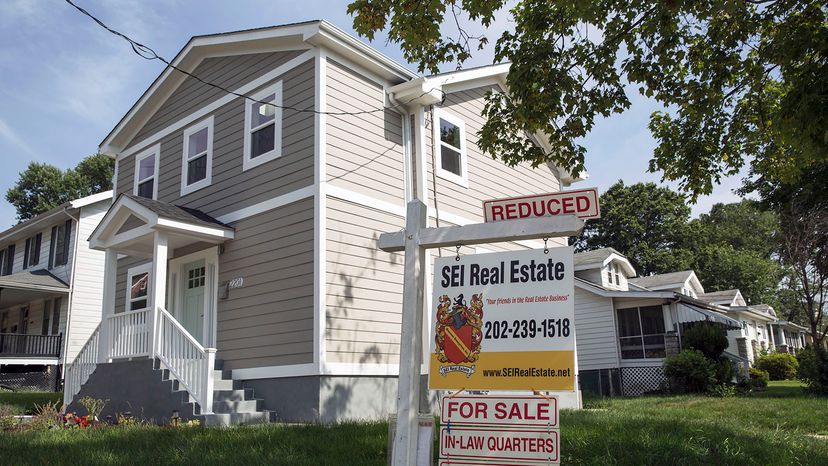
The Great Recession of 2007 to 2009 was the worst financial crisis in the United States since the Great Depression of the 1930s. The fallout from the Great Recession included the collapse of the housing market, major banks on the brink of failure, steep stock market losses, withered up retirement portfolios and double-digit unemployment.

Advertisement

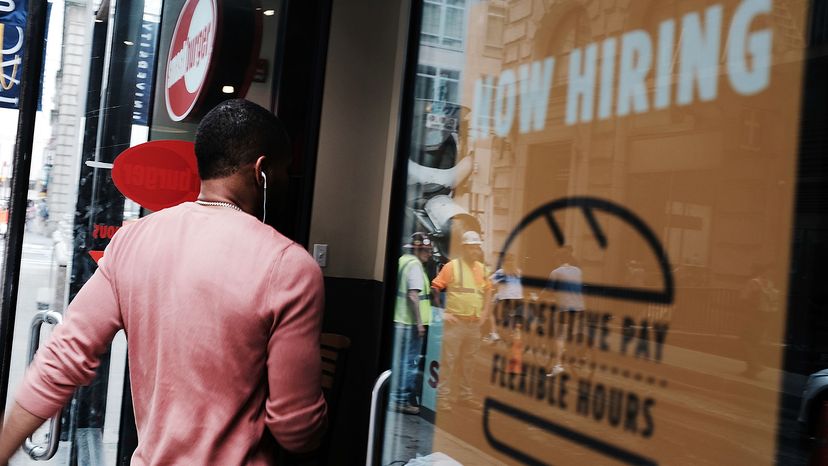
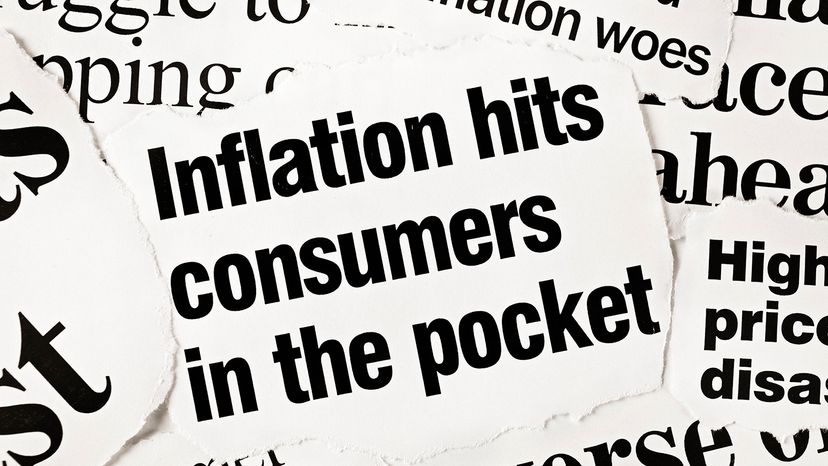
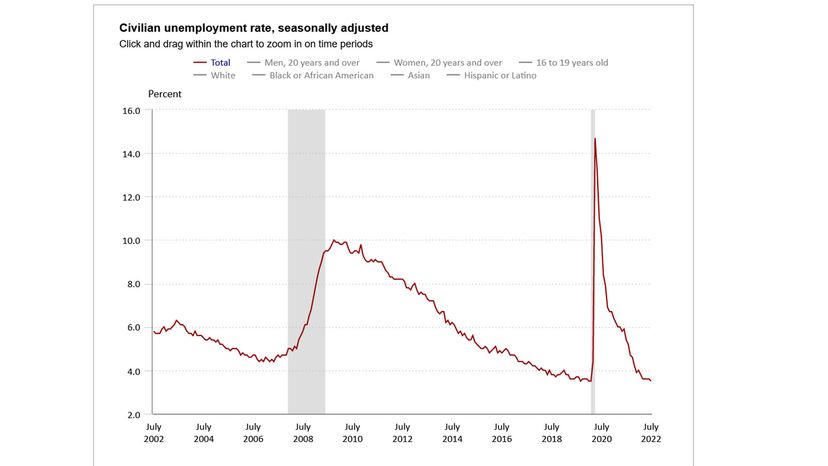
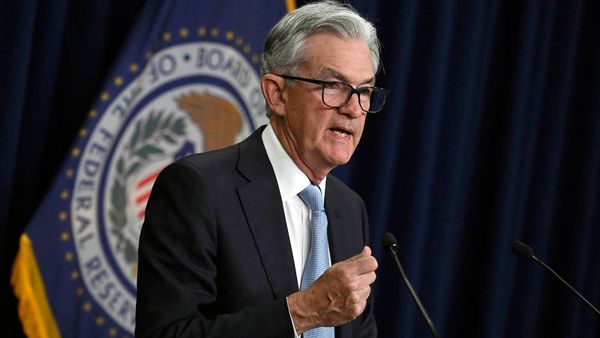
But the economy eventually recovered and recorded a decade of steady growth before the coronavirus outbreak nearly sank the stock market in March and April 2020 and sent the unemployment rate soaring. Now, in 2022, unemployment is low again, but concerns about high inflation and rising interest rates have some economists once again forecasting a recession on the horizon.

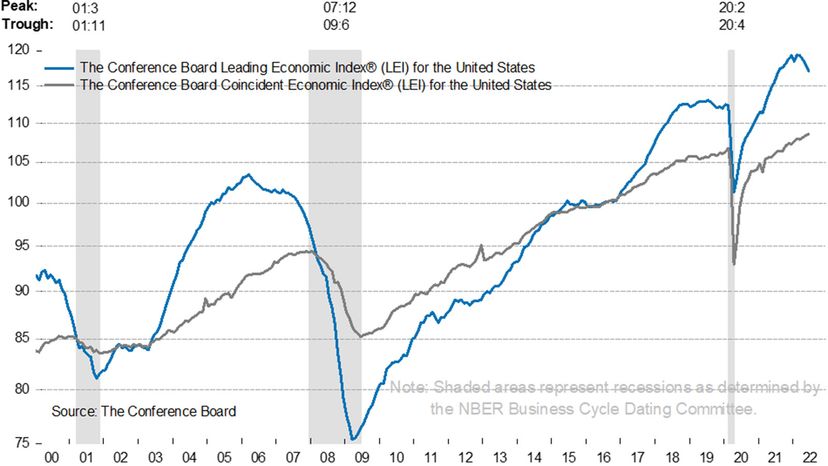
If you're trying to predict the economic future — good luck, even "experts" routinely get it wrong — it's time to familiarize yourself with the clearest warning signs of a looming recession. Here are seven.

7: The Treasury Yield Curve Flips

inverted yield curve
Normally, the yields for short-term bonds are lower than longer-term bonds, but every so often those rates flip upside down. In this graph, the gray bars signal a recession, which seems to occur always after the short-term bonds become higher than the longer-term bonds (i.e., an inverted yield curve). Federal Reserve Bank of St. Louis

One of the surefire signs of a looming recession is a geeky little graph called an inverted treasury yield curve. United States treasury bonds are the most reliable, low-risk investment around. But since the yield (or return) on treasury bonds is relatively low, investors tend to avoid sinking their money into bonds unless the economic future looks bleak.

When investors are nervous about the direction of the economy, the demand for long-term treasury bonds (five-year, 10-year and 30-year) goes up and their yields or interest rates go down. Normally, the yields for short-term bonds are lower than longer-term bonds, but every so often those rates flip upside down. And when that happens, a recession is usually around the corner.

Advertisement

In August 2019, the treasury yield curve inverted and the U.S. economy did indeed experience a recession about seven months later. But the 2020 recession was far from normal, since it was triggered by the outbreak of the coronavirus pandemic.

Still, it's worth paying attention to the treasury yield curve. The yield curve has flipped or inverted before the last seven recessions with only one false positive back in 1998. The good news is that it takes an average of 18 months between an inverted yield curve and the start of a recession, so there's plenty of time to stock up on canned goods and ramen noodles for the coming dry spell.

On Aug. 8, 2022, MarketWatch noted that the "two-year Treasury yield traded at a premium of 45.1 basis points over the 10-year — marking the deepest inversion of the curve since August 2000, according to Dow Jones Market Data."

6: Sustained Stock Market Losses

NYSE in June 2022
Traders work on the floor of the New York Stock Exchange Tuesday, June 14, 2022, in New York City. The Dow was up that morning following a drop on Monday of over 800 points, which sent the market into bear territory as fears of a possible recession loomed. Spencer Platt/Getty Images

The stock market is a reliable indicator of overall economic health — except when it isn't. Back in the 1960s, the economist Paul Samuelson famously quipped that the stock market predicted nine of the last five recessions. The joke (hilarious!) is that a stock market plunge doesn't always signal a recession.

But there is plenty of reason to pay attention to stock prices as a sign of what's to come. George Morgan, a professor of finance at Virginia Tech's Pamplin College of Business, explained in 2019 that the stock market gives a snapshot of the economy six months down the road.

Advertisement

"A sustained drop in equity values is a leading indicator of the lower profits expected to be earned by corporations or at least lower profits than the stock market had previously expected," Morgan said.

If businesses lower their expectations for the future, that means they'll be taking out fewer loans and hiring fewer people, which impacts the broader economy. And when stock prices across the board go down significantly, it starts to eat away at the long-term savings of average consumers, causing spending to drop.

When CNBC analyzed post-War stock market performance for hints of upcoming recessions, it found a strong correlation. The longer a bear market lasts (defined as a drop of 20 percent or more in stock prices), the greater the odds of it signaling a recession. Bear markets that cause recessions lasted 508 days on average.

The S&P 500 Index, considered a bellwether of overall stock market performance, entered "bear market" territory in June 2022, down 21 percent from its high in January. However, the market has been up August 10 and 11 as the Consumer Price Index report indicated that inflation might be cooling.

5: Runaway Wage Growth

hiring sign
"Wage inflation is the black widow of economic indicators," financial adviser Wes Moss said in an interview. Spencer Platt/Getty Images

The No. 1 expense for businesses is employee salaries and hourly wages. When unemployment levels are low, that leads to a scarcity of qualified workers on the job market, which forces employers to offer higher and higher pay. Wes Moss, chief investment strategist with Capital Investment Advisors and host of the weekly radio show "Money Matters," says that fast-growing wages are a sure sign of a coming recession.

"Wage inflation is the black widow of economic indicators," Moss says. "When wages grow 4 percent or more year after year, it becomes an unsustainable expense for businesses and they have to slow growth and cut jobs."

Advertisement

Both wages and salaries increased significantly starting in late 2020 after the worst of the coronavirus pandemic. Average salary increases in 2022, according to one survey, were 4.8 percent, the highest in decades. But one of the main factors driving those higher salaries is the next warning sign of a looming recession: inflation.

4: Rising Inflation

inflation
When inflation heats up too quickly, it forces the Federal Reserve to cool the economy down by raising interest rates. RapidEye/Getty Images

Like wage growth, some level of inflation is a good thing. It means that unemployment is low, workers are being paid well and they are out spending their money. As demand for consumer goods increases, so do retail prices, which is what drives inflation.

But when inflation heats up too quickly, it forces the Federal Reserve to cool the economy down by raising interest rates. The danger of raising interest rates is that it makes borrowing more expensive. And if companies are already nervous about an upcoming recession, they'll be even less likely to borrow and invest in new equipment and new hires if interest rates are high.

Advertisement

If the Fed plays its cards right, it can keep inflation at manageable levels — 2 percent is the target — without raising interest rates so high that they choke off economic growth. The timing of those rate increases is the key. If the Fed guesses wrong and raises rates right as the economy begins to sputter, it could accelerate an economic meltdown.

In 2022, so far the Fed has raised interest rates four times — including the two of the largest rate increases in four decades — to combat the highest inflation numbers since 1982.

Inflation hit a record 9.1 percent in June 2022 (over June 2021), so even a 5 percent salary raise would put you behind in terms of real buying power, if inflation continues at that pace. However there are a few signs that inflation may be slowing down. For instance, gas prices have fallen to $3.99 a gallon on Aug. 11, 2022, versus $5 a gallon in June 2022. And the inflation rate for July 2022 was 8.5 percent, slightly lower than July, due in large part to that gas price drop, CNBC reported. However, experts are divided on whether that June rate was an inflation peak.

3: Unemployment Bottoms Out

employment rates
A super-low unemployment rate could also be the smoke before an economic fire. Bureau of Labor Statistics

Historically, the U.S. economy has gone into recession nine months after the unemployment level reaches its lowest point or "trough." It makes sense that unemployment levels would start to rise in the lead up to a recession and spike during the worst of it. In 2009, at the height of the Great Recession, the U.S. unemployment rate hit 10 percent.

The hard part is knowing exactly when the unemployment rate has hit rock bottom. It's easy to look back on a 50-year graph and spot each trough and peak, but those movements are much harder to track in real time. That doesn't stop economists and investors from obsessively monitoring the weekly report of unemployment insurance claims looking for signs of a broader trend.

Advertisement

Right before the outbreak of the coronavirus pandemic, the unemployment rate dropped to 3.5 percent, the lowest in more than a decade. The unemployment rate skyrocketed in April 2020, but has been dropping ever since, with unemployment back to its record low of 3.5 percent in July 2022.

2: A Drop in Housing Construction and Sales

home for sale
Two of the clearest indicators of a pending recession are sharp drops in both new housing construction and home sales. Drew Angerer/Getty Images

The housing market is one of the major drivers of the U.S. economy. If you add up all of the money Americans spend on building houses, buying houses, renovating and renting houses, it adds up to 15-18 percent of gross domestic product (GDP). That's why two of the clearest indicators of a pending recession are sharp drops in both new housing construction and home sales.

Economists pay close attention to the number of housing "starts" or new housing construction projects breaking ground each month. An increase in housing starts means that builders are confident that the economy will continue to perform well over the next six months and that consumers will have the available cash to buy new homes.

Advertisement

Other housing indicators act as a barometer of consumer confidence, like the monthly reports of pending home sales and existing home sales. When consumers feel good about their future job security and earning potential, they are more likely to make a big financial plunge like buying a new home. When they worry about layoffs and stock market declines, housing sales numbers go down.

Looking back at housing data since 1960, housing starts have decreased 25 percent on average before each recession.

In July 2022, housing starts were down, and new mortgage applications decreased significantly as mortgage rates got higher (a result of the Fed raising its benchmark interest rate).

1: The Big Picture Gets Blurry

LEI graph
The Conference Board's Leading Economic Index (LEI) is a collection of 10 key economic indicators bundled into one convenient score. Conference board

Most of the indicators we've cited are individual numbers looking at a single aspect of the U.S. economy like unemployment or inflation. While all of those figures are loosely interrelated, sometimes it's helpful to take a step back and look at the big economic picture. One of the best measurements of overall economic health is the Conference Board's Leading Economic Index (LEI), a collection of 10 key economic indicators bundled into one convenient score.

The composite LEI score is called a "leading" economic index because it's composed of economic indicators that are supposed to lead or precede future developments. You'll recognize some of the 10 indicators tracked by the LEI, like stock prices and new building permits, but there are also some new ones. Here's the full list:

Advertisement

  • Average weekly hours, manufacturing
  • Average weekly initial claims for unemployment insurance
  • Manufacturers' new orders, consumer goods and materials
  • Institute for Supply Management Index of New Orders
  • Manufacturers' new orders, nondefense capital goods excluding aircraft orders
  • Building permits, new private housing units
  • Stock prices, 500 common stocks
  • Leading Credit Index, a composite of financial indicators related to credit and lending
  • Interest rate spread, 10-year Treasury bonds less federal funds
  • Average consumer expectations for business conditions

When the economic future looks bright, manufacturing orders grow, unemployment claims stay low and consumer confidence soars. That sunny outlook is reflected in a steadily increasing LEI score. But sometimes the opposite is true. Once the LEI falls into negative territory, "recession chances historically rise substantially," says investment adviser Moss. "Couple this with an inverted yield curve, where short-term interest rates are higher than longer-term interest rates and the chances of recession continue to rise."

In July 2022, the LEI was down for the fourth month in a row, prompting the senior director of research at the Conference Board to conclude, "A U.S. recession around the end of this year and early next is now likely."

Advertisement

Loading...