Unexpected Connections: 10 Oddest Economic Indicators

By: Dave Roos
This Somali munchkin cat is enjoying a cardboard snack. The increase or decrease of cardboard box sales is a good indicator of the state of the economy.
Nazra Zahri/Flckr/Getty Images

If you wanted to get a good idea of the current economic picture in the U.S, you could look at the gross domestic product (GDP) report or the monthly unemployment figures. You could also look at recent sales of men's underwear or Champagne. Economists make a strong argument that we are what we buy. And as strange as it seems, they can make accurate predictions about the economy's future health by looking at certain items we toss in our shopping carts [source: Davidson]. These items could be thought of as economic indicators.

Not all indicators have the same worth. Some are more reliable than others. And some measure other things besides what's going on in the economy. We've assembled a list 10 noteworthy, but odd, metrics, starting with the famously weird connection between lipstick and the stock market.

Advertisement

10: Lipstick vs. Nail Polish

The 'lipstick index' supposedly means that when lipstick sales increase, the economy is worsening but it has not proved to be always true.
BananaStock/Thinkstock

When the economy tanked during the 2001 recession, cosmetic company Estée Lauder saw a significant boom in lipstick sales. Its former chairman, Leonard Lauder, dubbed it the "lipstick index," explaining that women seek out cheap "luxuries" when money is tight [source: Wolverson].

Turns out that Lauder was half right. Women do splurge on cheaper treats when the economy is weak, but fashion trends are another strong influence. During the Great Recession, for example, lipstick sales fell with the rest of the economy in 2008, but nail polish sales went through the roof, up 65 percent from 2008 to 2011 [sources: Davidson, Wolverson].

Advertisement

The longer the recession, though, the weaker the relationship between down markets and "pick-me-up" sales. As the economy continued to limp along in 2013, U.S. perfume and nail product sales flattened and even declined as Americans cut back further on discretionary spending [source: Ng].

9: Coke Is It

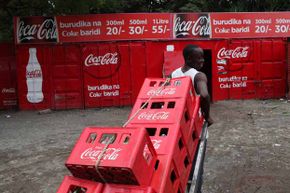
A Coca-Cola salesman in Nairobi, Kenya gets to work. Coke sales in Africa measure political stability.
Marco Di Lauro/Getty Images

Coca-Cola is the biggest private employer in Africa and its sugary soft drinks are cheap and widely available even in the humblest rural store. Coke is so popular in Africa — more than 36 billion bottles are sold each year — that the company has identified a direct relation between Coke sales and political stability in African nations [source: The Economist].

When Kenya erupted in post-election violence in 2008, Coke sales slumped then bounced back. As the country stabilized, more delivery of the drink in rural villages and urban slums was possible. The most dramatic indicators of instability are the countries that can't even get their act together to operate a bottling plant, like Somalia and Eritrea, whose supply lines were plundered by pirates and warlords [source: The Economist].

Advertisement

If the Coke indicator holds true, then the political future is bright for Africa, Asia and Eastern Europe, which collectively provided a 5 percent boost in revenue for 2012 over 2011 [source: Trefis]. The Coke index doesn't function as well in North America and Western Europe, where changing tastes and higher prices are more likely to affect soft drink sales.

8: Burgernomics

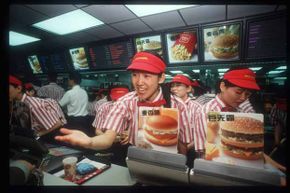
A worker takes an order from a customer in China's first McDonald's restaurant, back in 1992. According to the 'Big Mac Index,' global currency values can be measured by looking at the price of a Big Mac in various countries.
Forrest Anderson/Getty Images

Back in 1986, writers for The Economist came up with a tasty way of measuring purchasing power parity or PPP by comparing the price of a McDonald's Big Mac across different countries. The exercise turned out to be a handy — if not entirely accurate — way of predicting which global currencies were undervalued or overvalued compared to the U.S. dollar [source: The Economist].

Here's how the theory works. In 2011, the price of a Big Mac in China was U.S. $2.27 versus $4.07 stateside. According to the Big Mac Index, that meant that the Chinese yuan was 44 percent undervalued compared to the U.S. dollar. In Brazil, on the other hand, a Big Mac was 51 percent more expensive than in America (at $6.16), making the real wildly overvalued as a global currency [source: The Economist].

Advertisement

Over time, the theory goes, exchange rates should drift toward equality or PPP. That's critical information for folks who trade on the FOREX or foreign exchange market. The Economist is quick to note, however, that Big Mac prices are affected by other factors, most notably wages and cost of living standards, which vary widely in developing countries.

7: Hemlines

Since skirts of all different lengths are popular right now, does that indicate the economy is schizophrenic?
Anna Webber/Getty Images for Benefit Cosmetics

Some economic indicators are so much fun, it hardly matters if they're actually true. Exhibit A is the "hemline theory" promoted by economist George Taylor back in the Roaring '20s. The Wharton School of Business professor couldn't help but notice the shockingly short dresses worn by flappers during the flush years before the stock market crash of 1929. According to Taylor's theory, women raised their skirts in good times to show off their expensive silk stockings. When they couldn't afford new stockings, the hemlines fell down [source: Carney].

Does that mean that a trend toward shorter or longer skirts can accurately predict movements in the stock market? Hardly. A team of economic researchers from the Netherlands compared hemline lengths with economic indicators from 1921 to 2009 and found that skirt lengths actually trailed the market by three to four years. In other words, skirts rose three years after an economic turnaround [source: Carney].

Advertisement

Clothing buyers for major retailers point out fashion trends work independently of the economy, although women are more likely to splurge on a name-brand skirt — long or short — when economic confidence is high, and opt for the discount version when money is tight [source: Sincere].

6: Follow the Wire

Musician Wyclef Jean (l) passes out $50 Western Union gift cards to fans at an event in Los Angeles. Western Union earnings help to measure migration trends.
Kevin Parry/WireImage/Getty Images

For millions of migrant workers worldwide, Western Union is the fastest, simplest and most reliable way to send money to family and friends back home. The company, which launched the telegram industry in 1851, is so popular with migrant workers that Western Union's earnings reports are one of the most accurate reflections of global migration trends.

Back in 2003, for example, Western Union made more than half of its earnings from migrant workers in the U.S. sending money home to countries like Mexico and El Salvador. By 2013, only 30 percent of Western Union's revenue originated in the U.S. Instead, the company saw a significant increase in money transfers from emerging economies like Brazil, Chile and Malaysia [source: Jordan]. Since many migrant workers lack legal documentation, Western Union records are the next best thing to census data for determining migration trends worldwide.

Advertisement

5: Men's Underwear

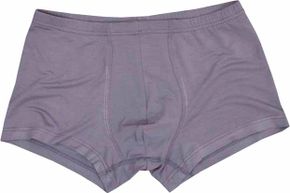
Since men’s underwear represents the ultimate non-luxury item, Alan Greenspan theorized that any slight dip in sales signaled a serious drop in discretionary income.
iStock/Thinkstock

This one comes from the mind of none other than former Federal Reserve Chairman Alan Greenspan, known as "the oracle" for his uncanny ability to keep a pulse on the U.S. economy. According to media reports, Greenspan had a number of his own favorite economic indicators, including trends in dry cleaning (a luxury reserved for flush times, he believed) and strangely, sales of men's underwear [source: NPR].

If you look at a graph of men's underwear sales over the past several decades, it's almost comically flat. Men don't run out and buy underwear because it's fashionable; they buy it when they need it, and only when they need it. Since men's underwear represents the ultimate non-luxury item, Greenspan theorized that any slight dip in sales signaled a significant drop in discretionary income [source: Kurtzleben].

Advertisement

4: Waffle House

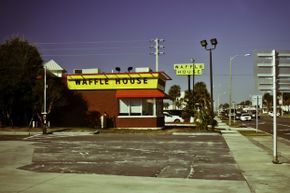
After a hurricane, FEMA officials check to see how many Waffle Houses in the area are operational and use that information to determine the severity of the storm damage.
Dominic Bugatto/Flickr Vision/Getty Images

The yellow-and-black Waffle House sign is literally a beacon in the storm during hurricane season in the U.S. When most other restaurants and grocery stores shut down during natural disasters, the Southern chain and its famous "smothered, covered and chunked" hash browns keeps the lights on — or at least the grill. Waffle House has such a strong reputation for riding out storms that the Federal Emergency Management Agency (FEMA) measures the severity of storm damage by what Waffle House is serving on its menu [source: Bauerlein].

This is not a joke. FEMA chief Craig Fugate uses a color-coded "Waffle House Index" to determine how hard a community has been hit by a storm. If the local Waffle House is serving a full menu, that's green. If the restaurant has lost power, but is still open and serving a limited, grill-only menu, that's yellow. Red means the restaurant is closed, a "really bad" sign, according to Fugate [source: Bauerlein].

Advertisement

3: Cardboard Boxes

Since almost all goods are shipped in cardboard boxes, an increase in sales is a good indicator of an all-round increase in consumer activity.
Lucidio Studio Inc/Photographer's Choice RF/Getty Images

Cardboard boxes are the workhorses of the commercial shipping industry. Just about every consumer product you can imagine — shoes, cans of soup, tennis balls, light bulbs — is shipped in "corrugated" as it's known in the industry. That's why the manufacturing and sales of cardboard boxes are such reliable and accurate indicators of economic performance.

Here's how it works. Consumers have more money to spend, so they buy more socks. The store notices that it's about to run out of socks, so it orders more from the factory. The sock factory, noticing an uptick in orders, goes out and buys more cardboard boxes to ship out those beautiful socks. The nice thing about cardboard is that it's not specific to socks or any single industry. An increase in cardboard orders signals a widespread increase in consumer activity [source: Obel].

Advertisement

2: Graffiti

Researchers have found a link between the prevalence of graffiti and an increase in antisocial behavior.
Image Source/Getty Images

In a 1969 experiment, famed Stanford psychologist Philip Zimbardo parked a broken-down car in two neighborhoods: one low-income urban, the other middle-class suburban. In the urban neighborhood, where broken windows and graffiti were everywhere, the car was stripped within hours. In the suburbs, the car sat untouched for more than a week until a researcher busted a window himself, after which the vandals set in [source: Kelling and Wilson].

Two criminologists writing in the Atlantic used the "broken windows" theory to suggest a method of reducing crime: Cracking down hard on petty offenses like turnstile-jumping would deter more serious crimes like robbery and murder. Many cities implemented this, most famously New York City under Mayor Rudolph Giuliani. And while the crime rate in New York did decrease, social scientists failed to prove a causal relationship between outward signs of neglect and crime rates [source: Sterbenz]

Advertisement

However, one intriguing 2008 study out of the Netherlands seemed to show a connection. The researchers placed a "no graffiti" sign in front of a wall where people often parked their bikes. Then they attached advertising flyers to the handlebars of the bikes. First, they painted the wall a solid color and counted how many flyers were tossed on the ground. Another day, they sprayed the wall with graffiti and counted the littered flyers. More than twice as many people littered when there was graffiti on the wall [source: Bryner].

1: Champagne

Sipping expensive Champagne often represents the good life; so much in fact, that Champagne sales accurately predict American household income for the following year.
Fuse/Thinkstock

If you uncorked a lot of Champagne in the past year, you might be in for a raise (or you might just be a bartender who works a lot of weddings). According to research conducted by NPR's Planet Money team, consumption of Champagne in the U.S. can predict, with 90 percent accuracy, the average American household income a year later [source: Davidson].

The researchers tracked Champagne sales and average household income from 1996 through 2011 and found an alarmingly accurate trend. The line for inflation-adjusted household income perfectly tracked how much Champagne Americans downed the year before. The peak bubbly years were, not surprisingly, 1999 and 2007, right before the Internet and housing bubbles were about to burst.

For lots more information about odd economic trends and predictions, check out the related links on the next page.

Lots More Information

Author's Note: Unexpected Connections: 10 Oddest Indicators

Conducting research for a story like this, I'm always struck by the gap between my self-perception and the larger statistical reality. I like to think of myself as a unique person who makes choices based on my own unpredictable whims and desires. But when I pull back to the macro level, I see how my supposedly individual choices — particularly what I buy — fall squarely within the bounds of "average middle-class white guy." I'm even proposing a new sociological term for it: Ikea syndrome. When I shop at a store like Ikea, I feel like the things I buy reflect my own quirky and colorful yet sensible style. Yet a week later, I visit a friend's house and notice the same exact throw pillows and curtains at his place. It turns out that our personal choices are strongly influenced by collective tastes and broad economic trends. My New Year's resolution — to become a statistical anomaly.

Related Articles

  • Bauerlein, Valerie. "How to Measure a Storm's Fury One Breakfast at a Time. The Wall Street Journal. Sept. 1, 2011. (Nov. 20, 2013) http://online.wsj.com/news/articles/SB10001424053111904716604576542460736605364
  • Bryner, Jeanna. "Graffiti Triggers Crime and Littering." LiveScience. Nov. 20, 2008. (Nov. 20, 2013) http://www.livescience.com/7599-graffiti-triggers-crime-littering.html
  • Carney, John. "Hemlines are plunging, is economy next?" USA Today. Feb. 23, 2012. (Nov. 20, 2013) http://usatoday30.usatoday.com/money/economy/story/2012-02-26/cnbc-hemline-length-economy/53227022/1
  • Davidson, Adam. "What Nail Polish Sales Tell Us About the Economy." The New York Times. Dec. 14, 2011. (Nov. 20, 2013) http://www.nytimes.com/2011/12/18/magazine/adam-davidson-economic-indicators.html?_r=0
  • The Economist. "Beefed-up burgernomics." July 30, 2011. (Nov. 20, 2013) http://www.economist.com/node/21524811
  • The Economist. "Currency comparisons, to go." July 28, 2011. (Nov. 20, 2013) http://www.economist.com/blogs/dailychart/2011/07/big-mac-index
  • The Economist. "Index of happiness?" July 3, 2008. (Nov. 20, 2013) http://www.economist.com/node/11670946
  • Jordan, Miriam. "Latin Migrants Shift Sights from U.S. to Neighbors." The Wall Street Journal. Nov. 18, 2013. (Nov. 20, 2013) http://online.wsj.com/news/articles/SB10001424052702303531204579203861742570436?mod=ITP_pageone_0
  • Kelling, George H. and Wilson, James Q. "Broken Windows." The Atlantic. March 1, 1982. (Nov. 20, 2013) http://www.theatlantic.com/magazine/archive/1982/03/broken-windows/304465/
  • Kurtzleben, Danielle. "Six Unusual Economic Indicators." U.S. News & World Report. Feb. 13, 2012. (Nov. 20, 2013) http://www.usnews.com/news/articles/2012/02/13/six-unusual-economic-indicators
  • Ng, Serena. "What Sales of $3 Nail Polish Say About the U.S. Economy." The Wall Street Journal. Sept. 17, 2013. (Nov. 20, 2013) http://blogs.wsj.com/corporate-intelligence/2013/09/17/what-sales-of-3-nail-polish-say-about-the-u-s-economy/
  • NPR. "Alan Greenspan's Underwear Drawer." The Bryant Park Project. Jan. 1, 2008. (Nov. 30, 2013) http://www.npr.org/templates/story/story.php?storyId=17759341
  • Obel, Mike. "Economic indicator: Look inside the cardboard box." Tampa Bay Times. April 7, 2009. (Nov. 30, 2013) http://www.tampabay.com/news/business/economic-indicator-look-inside-the-cardboard-box/990416
  • Sincere, Michael. "Hemline Index falls out of fashion." MarketWatch. Nov. 24, 2010. (Nov. 20, 2013) http://www.marketwatch.com/story/hemline-index-falls-out-of-fashion-2010-11-24?pagenumber=1
  • Trefis. "Coca-Cola Slurps Up More Emerging Markets Growth." Forbes. Feb. 14, 2013. (Nov. 20, 2013) http://www.forbes.com/sites/greatspeculations/2013/02/14/coca-cola-slurps-up-more-emerging-markets-growth/
  • Wolverson, Roya. "What Lipstick Tells Us About the Economy." Time. Sept. 14, 2011. (Nov. 20, 2013) http://business.time.com/2011/09/14/what-lipstick-tells-us-about-the-economy/

Advertisement

Loading...