How Six Sigma Works

Motorola has revolutionized quality improvement and business processes with its Six Sigma program. See more pictures of corporate life.
Rob Melnychuk/Photodisc/Getty Images

­­Today, Motorola is one of the most respected communications brands in the world, but in 1986, the company faced some serious challenges. It was struggling to compete with foreign manufacturers, and its own vice president of sales admitted that the quality of its products was pretty poor. So, then-CEO Bob Galvin set an ambitious goal: Achieve tenfold improvement in product quality and customer satisfaction in five years. But how? The plan focused on global competitiveness, participative management and, most importantly, stringent quality improvement.

­

Advertisement

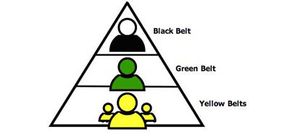
Motorola quality engineer Bill Smith dubbed the quality improvement process Six Sigma. It was a catchy name, and the results were even more striking. In 1988, Motorola won the Malcolm Baldridge National Quality Award based on the results it had obtained in just two years. Now, more than two decades later, thousands of companies use Six Sigma to optimize business processes and increase profitability. In fact, an entire industry has grown up around Six Sigma: Motorola offers extensive training through Motorola University, an army of experts called Black Belts travels the globe helping organizations set up and run Six Sigma projects, and hundreds of books about Six Sigma have been published.

One might think that, given the time and resources dedicated to it, Six Sigma would be too complicated for the layperson to understand. Not true. At its core, Six Sigma is a relatively simple concept to grasp -- which we'll demonstrate in this article by answering the following basic questions:

  • What is Six Sigma?
  • When was it developed?
  • How is it implemented?
  • Where is it used?

What exactly is Six Sigma?

In its most fundamental form, Six Sigma is a measure of the number of defects in a specific process or operation -- for example, a manufacturing process used to make a specific part. In Six Sigma, you're not worried about defective parts as a whole, but something called defect opportunities. A defect opportunity takes into account three important variables:

  1. All of the different defects that occur on an assembled part
  2. The number of places on that part where the defects can occur
  3. And every production step that could cause one or more of the defects on the part

As an example, let's say you're manufacturing small metal cubes. Two major defects are typically found on the cubes: a crack and a dent. The crack is one defect; the dent is a second. Now let's say those defects are found only on three of the cube's six faces. Finally, let's assume there are three steps in the manufacturing process where those defects are typically introduced.

Advertisement

Clearly, there are several opportunities for a defect to occur. To calculate how many, you simply multiply: 2 x 3 x 3, for a total of 18 opportunities. Now, if you see cracks or dents in 5 percent of the metal cubes that come off the production line, the number of defects per opportunity is .00278 (.05 divided by 18). To find the number of defects per thousand opportunities, you multiply .00278 by 1,000 to get 2.78. ­

Motorola engineers decided that the defects-per-thousand metric wasn't sensitive enough for their new Six Sigma initiative. They decided that defects per million opportunities (DPMO) eliminated errors due to small sample size and made for a more accurate determination of quality. To find the number of defects per million opportunities in our example above, you multiply .00278 by 1,000,000 to get 2,780 DPMO.

On the next page, we'll discuss the scale that Motorola came up with to evaluate quality based on DPMO numbers.

Six Sigma Calculations

To give such numbers meaning, the engineers at Motorola set up a scale to evaluate the quality of a process based on these defect calculations. At the top of the scale is Six Sigma, which equates to 3.4 DPMO, or 99.9997% defect-free. In other words, if you have a process running at Six Sigma, you've almost eliminated all defects -- it's nearly perfect. Of course, most processes don't run at Six Sigma. They run at Five Sigma, Four Sigma or worse. Here's the full scale to get an appreciation of the numbers involved:

Five Sigma = 233 DPMO, or 99.98% defect-free

Advertisement

Four Sigma = 6,210 DPMO, or 99.4% defect-free

Three Sigma = 66,807 DPMO, or 93.3% defect-free

Two Sigma = 308,538 DPMO, or 69.1% defect-free

One Sigma = 691,462 DPMO, or 30.9% defect-free

As you might expect, performing these calculations in a modern manufacturing environment is not a simple matter of counting up a few defects and punching numbers into a calculator. Careful planning and a methodical approach are essential. So, at the same time that Motorola's engineers were developing the mathematics, they established a problem-solving methodology that enabled them to consistently duplicate these calculations regardless of the process or environment. This methodology is as much a part of Six Sigma today as the mathematical concepts it is based on. Indeed, as Six Sigma has evolved, it has become closely associated with other business strategy methodologies, such as Balanced Scorecard.

That means different people at different times will define Six Sigma quite differently. Some will describe it as a metric, or a measurement of defects. Others will describe it as a methodology, a way to solve problems. And still others call it a business management system. In the next section, we'll take a closer look at Six Sigma history to give more context to all of its various meanings.

Six Sigma History

2008 HowStuffWorks

Motorola claims that its people invented Six Sigma, but the principles behind the methodology date back to 1809. That's when Carl Gauss, a German mathematician, published "Theoria Motus Corporum Arithmeticae." In this book, Gauss introduced the concept of the bell curve, a shape that can often represent the variation that occurs in a controlled process.

Before we dive into the statistics of the bell curve, let's talk a moment about variation. Variation is defined as deviation from expectation. Every process and activity has inherent variation. If you're making widgets, every widget will vary slightly. If you're swinging a baseball bat, every swing will be different from the swing before it. And if you're signing your name, every signature will contain subtle differences that no other signature will possess. Variation is inevitable and unavoidable. The trick, of course, is to limit it. Some variation is probably OK. Too much leads to the kind of defects we described in the last section.

Advertisement

When data is collected from a typical process and plotted on an x-y axis, the nature of the variation starts to become clear. For example, say you're an employer with an 8 a.m. start time for your business. You want to find out how many employees actually arrive at 8 o'clock. So, you collect the data below:

If you were to plot the data in a bar chart that depicts the frequency of occurrence for each employee start time, you would end up with the chart below. This kind of bar chart is known as a histogram.

Image courtesy William Harris

The histogram provides a visual representation of your variation. Notice that the variation is spread out evenly across a range of values. This is called a normal distribution, and the result is a bell-shaped curve. The diagram below shows the same distribution with the bell curve superimposed over it.

Image courtesy William Harris

Now let's look at a bell curve without any underlying data. Such a curve is shown below so that you can clearly see two important measurements -- the mean and the specification limit. The mean is the peak of the curve. The specification limit is the value designating acceptable from unacceptable performance. There usually is an upper and lower specification limit for a process -- and the areas on the outside of the limits are called the tails.

Image courtesy William Harris

On the next page we'll talk about standard deviation, which tells us how much variation exists for a given process.

Standard Deviation

2008 HowStuffWorks

Standard deviation, represented by the lowercase form of the Greek letter sigma, is a statistic that tells you how tightly the data points are clustered around the mean for a given process, which in turn tells you how much variation exists. When data points are tightly clustered around the mean and the bell-shaped curve is steep, the standard deviation -- and hence the variation -- is small. When the data points are spread apart and the bell-shaped curve is flat, the standard deviation -- and the variation -- is great.

Statisticians generally talk about the number of standard deviations from the mean. One standard deviation in either direction of the mean accounts for 68 percent of the data in the group. Two standard deviations account for 95 percent of it. And three standard deviations account for 99 percent of the data. In Six Sigma, the big question is: How many standard deviations can fit between the mean and the specification limit? We can calculate that number using the formula to the right.

Advertisement

In this formula, Z is the Z score, or Sigma score. A low Z score means that a significant portion of the tail of the distribution is extending past the specification limit. A high Z score means that not much of the distribution is extending past the specification limit. The table below shows Z scores related to defects per million opportunities. Notice that the Sigma values we identified earlier are represented here.

2008 HowStuffWorks

So, when people in Six Sigma talk about the "sigma of a process," what they're really referring to is the Z score. But the key point is this: You can improve the quality of a process by reducing variation. Your goal is Six Sigma quality, which is an attempt at perfection, or reducing variation to less than four defects per million opportunities measured.

Clearly, Motorola didn't invent the statistics behind Six Sigma. What the company did do is apply the concepts of Gaussian distribution to its manufacturing process with a rigor that had never been seen before. At first, Six Sigma remained an internal initiative at Motorola. But it didn't take long for other companies to hear about Motorola's achievements and to want similar results. In response, Motorola leaders traveled the world teaching Six Sigma to other organizations. Two of the early adopters were Allied Signal and GE. GE did much to popularize Six Sigma, probably because of the results it claimed -- $12 billion in savings in its first five years of use.

In the early years of Six Sigma, the focus was on improving product quality, mostly in manufacturing settings. Soon, however, it became clear that Six Sigma was something more than a way to reduce defects -- it could be used to run the business day-to-day, especially in organizations that truly embraced Six Sigma from top executives down to line workers. Gradually, the definition of Six Sigma also evolved: to achieve a level of quality that satisfies the customer and minimizes supplier losses.

Today, Six Sigma is a business in its own right. Motorola offers Six Sigma consulting and training services through its Motorola University. The company has trained and certified thousands of Six Sigma experts who either work at or consult with organizations all over the world. Motorola is not alone. There are scores of consultants offering a range of Six Sigma-related services, from training and certification to process mapping and implementation.

Six Sigma Implementation

Image courtesy William Harris

In large companies with global supply and manufacturing operations, implementing Six Sigma is no small feat. There are generally two ways it happens. One way is through a separate organization that provides Six Sigma services to the main business. In this model, all Six Sigma projects run through the independent organization, making it easy to measure the impact of the changes. However, this arrangement can create a "we versus them" mentality that can undermine the effectiveness of the Six Sigma initiatives.

To avoid this tension, other companies take a more integrated approach. In this model, Six Sigma is incorporated into every employee's job, with a few highly trained experts acting as facilitators. This makes it more challenging to measure the impact of Six Sigma, but it helps create a culture in which a commitment to quality and excellence is pervasive.

Advertisement

Either way, Six Sigma relies heavily on teams of people working together, not on individual effort. A team can vary, but it will often include Six Sigma experts, process experts, data specialists, communicators and customers. A customer, in this case, refers to any person, internal or external, who is affected by a process or product change. This could be a person on the production line, someone in sales or marketing, a distributor or the ultimate end-user of a product or service. In fact, the customer may be the most important person on the team, because it is the customer who defines quality. It is his or her expectation of performance, reliability, competitive prices or on-time delivery that sets the bar.

Another critical role is that of team leader. The leader of a Six Sigma project must be extremely proficient in the technical aspects of Six Sigma statistics and process. If a project requires a high degree of Six Sigma expertise, it will be led by a Black Belt, a term borrowed from martial arts. Black Belts possess deep knowledge of all Six Sigma methods and tools and are assigned to lead projects that return a bottom-line value of $150,000 to an organization. If a project isn't as complex, it will be led by a Green Belt. Green Belts are qualified to solve the majority of process problems that arise in manufacturing environments and can always consult with Black Belts if they come up against a particularly challenging problem.

Yellow Belts represent everyone else on the team. They're not immersed in the details of the project and therefore don't require the same level of Six Sigma training or skill. That said, though, Yellow Belts are essential. They do apply some elements of the Six Sigma methodology as they help the Green Belt meet project goals and objectives. Yellow Belts are staff members, administrators, operations personnel and anyone else who might play a role.

Next, we'll learn about the DMAIC model for process improvement.

DMAIC Model

The Six Sigma process doesn't end with the solution -- companies have to sustain progress over the long haul.
­Digital Vision/Getty Images

Process is just as important as people. Most Six Sigma teams use what is known as the DMAIC model for process improvement. DMAIC stands for:

Define opportunity

Advertisement

Measure performance

Analyze opportunity

Improve performance

Control performance

Let's look at each of these steps in greater detail:

Define Opportunity: A Six Sigma project starts with a very specifically defined problem. Most people are used to defining problems broadly. For example, a business owner might say that accounts receivable is a concern. But such a definition won't work in Six Sigma. A better definition states the problem in quantitative terms. The business owner in the example above could revise his problem to get it to Six Sigma standards if he said, "Thirty percent of unpaid invoices are more than 45 days past due." With his problem specifically stated, he can now make meaningful measurements.

Measure Performance: Defining the problem is just the beginning. Next comes the most time-consuming part of the DMAIC methodology: determining the characteristics that influence the behavior of your process. This is accomplished by making measurements and collecting data.

Analyze Opportunity: It's not enough, however, simply to collect data. You must analyze the data using powerful mathematics and statistical tools. When you employ those tools properly, you get a clear picture of the variation in your process -- and how to limit it. Analysis reveals whether or not a problem is real or just a random event. If the event is random, then there is no solution within the Six Sigma framework.

Improve Performance: Once it's been determined that the problem is real and not a random event, Six Sigma teams look to identify possible solutions. Solutions must be tested to see how they interact with other input variables. Ultimately, the team chooses the best solutions for implementation.

Control Performance: It might seem that the application of a solution ends the Six Sigma process, but it doesn't. To make sure a solution can be sustained over the long term, control planning is required. Control planning involves collecting quality control data and verifying measurements according to a regular schedule. This ensures that processes continue to run efficiently and deliver peak performance.

Six Sigma experts use specific methods to carry out the DMAIC model -- find out about them on the next page.­ ­

Six Sigma Tools

Image courtesy William Harris

Black and Green Belts use a variety of tools to drive quality improvements within the DMAIC model. Many of these tools have been incorporated into Six Sigma software so that the computer carries out the underlying calculations. Most can be classified into two categories: process optimization tools, which enable teams to design more efficient workflows, and statistical analysis tools, which enable teams to analyze data more effectively.

Here's an overview of some of the most important tools:

Advertisement

Quality Function Deployment (QFD): The QFD is used to understand customer requirements. The "deployment" part comes from the fact that quality engineers used to be deployed to customer locations to fully understand a customer's needs. Today, a physical deployment might not take place, but the idea behind the tool is still valid. Basically, the QFD identifies customer requirements and rates them on a numerical scale, with higher numbers corresponding to pressing "must-haves" and lower numbers to "nice-to-haves." Then, various design options are listed and rated on their ability to address the customer's needs. Each design option earns a score, and those with high scores become the preferred solutions to pursue.

Fishbone Diagrams: In Six Sigma, all outcomes are the result of specific inputs. This cause-and-effect relationship can be clarified using either a fishbone diagram or a cause-and-effect matrix (see below). The fishbone diagram helps identify which input variables should be studied further. The finished diagram looks like a fish skeleton, which is how it earned its name. To create a fishbone diagram, you start with the problem of interest -- the head of the fish. Then you draw in the spine and, coming off the spine, six bones on which to list input variables that affect the problem. Each bone is reserved for a specific category of input variable, as shown below. After listing all input variables in their respective categories, a team of experts analyzes the diagram and identifies two or three input variables that are likely to be the source of the problem.

Cause-and-Effect (C&E) Matrix: The C&E matrix is an extension of the fishbone diagram. It helps Six Sigma teams identify, explore and graphically display all the possible causes related to a problem and search for the root cause. The C&E Matrix is typically used in the Measure phase of the DMAIC methodology.

­Failure Modes and Effects Analysis (FMEA): FMEA combats Murphy's Law by identifying ways a new product, process or service might fail. FMEA isn't worried just about issues with the Six Sigma project itself, but with other activities and processes that are related to the project. It's similar to the QFD in how it is set up. First, a list of possible failure scenarios is listed and rated by importance. Then a list of solutions is presented and ranked by how well they address the concerns. This generates scores that enable the team to prioritize things that could go wrong and develop preventative measures targeted at the failure scenarios.

Learn about the last three Six Sigma tools on the next page -- and find out where the concept could be expanding in the future.­

More Six Sigma Tools

Image courtesy William Harris

Here are the rest of the Six Sigma tools:

T-Test: In Six­ Sigma, you need to be able to establish a confidence level about your measurements. Generally, a larger sample size is desirable when running any test, but sometimes it's not possible. The T-Test helps Six Sigma teams validate test results using sample sizes that range from two to 30 data points.

Advertisement

Control Charts: Statistical process control, or SPC, relies on statistical techniques to monitor and control the variation in processes. The control chart is the primary tool of SPC. Six Sigma teams use control charts to plot the performance of a process on one axis versus time on the other axis. The result is a visual representation of the process with three key components: a center line, an upper control limit and a lower control limit. Control charts are used to monitor variation in a process and determine if the variation falls within normal limits or is variation resulting from a problem or fundamental change in the process.

Design of Experiments: When a process is optimized, all inputs are set to deliver the best and most stable output. The trick, of course, is determining what those input settings should be. A design of experiments, or DOE, can help identify the optimum input settings. Performing a DOE can be time-consuming, but the payoffs can be significant. The biggest reward is the insight gained into the process.

The Future of Six Sigma

Although Six Sigma has been around since the 1980s, it continues to evolve and change. Some of those changes involve the addition of new tools that have been developed and refined in practical, real-world situations. Other changes are related to how Six Sigma teams are organized. For example, in recent years, the Six Sigma White Belt has emerged. White Belts require much less training than Green or Black Belts and therefore offer a more rapid return on investment. Now, medium- and small-sized companies have access to all of the benefits that come with Six Sigma implementation.

But even large companies such as Motorola continue to push their Six Sigma programs to new levels. In 2003, the company began to see fewer benefits and savings coming from its Six Sigma methodology as costs related to poor quality began to rise once again. As a result, Motorola overhauled Six Sigma with powerful new tools, insights and advances. The changes worked: In 2004, Motorola achieved 42 percent revenue growth and an increase of 257 percent in earnings per share over the previous year's first quarter performance. This has rejuvenated interest in Six Sigma and has ensured its position as a serious business tool, not just a fad that will slowly fade into business history.

For more information about Six Sigma, take a look at the links on the next page. 

Lots More Information

Related HowStuffWorks Articles

More Great Links

  • Arabe, Katrina C. "Six Things You Should Know About Six Sigma." ThomasNet, June 23, 2004. http://news.thomasnet.com/IMT/archives/ 2004/06/6_things_you_sh.html?t=archive
  • Brussee, Warren. "All About Six Sigma." McGraw-Hill, 2006.
  • Dushame, Dirk. "Six Sigma Survey: Breaking Through the Hype." Quality Digest. http://www.qualitydigest.com/nov01/html/sixsigmaarticle.html
  • Gygi, Craig, DeCarlo, Neil and Williams, Bruce. "Six Sigma for Dummies." John Wiley & Sons, 2005.
  • Motorola University. http://www.motorola.com/motorolauniversity.jsp
  • The Quality Portal - Six Sigma Overview. http://thequalityportal.com/q_6sigma.htm
  • "What is Six Sigma? The Roadmap to Customer Impact." GE.

­­ ­