How the Cost of Education Works

By: Alia Hoyt
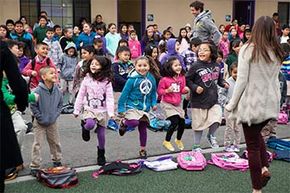
kids jumping at school
The entire student body at Rocketship SI Se Puede charter elementary school dances during 'launch,' the all-school morning program, in San Jose, California in 2014. See school lunch pictures.
Melanie Stetson Freeman/The Christian Science Monitor via Getty Images

The U.S. spends a lot on public education, but how much is "a lot"? How much of the federal and state budgets go to education? And with the fairly dismal reading and math scores and graduation rates, do Americans get their money's worth?

The problem with education, like pretty much everything else in life, is that schools don't just run themselves. They require administrators, teachers, students, equipment and facilities, all of which cost money – and lots of it. Taxpayer dollars are a major source of school funding, but few know exactly where and how Americans' hard-earned cash is shelled out, and it can be difficult to decipher the system unless you know where to look. Without the tools, staff and facilities necessary to achieve academic progress, children are far less likely to thrive on a long-term basis, with 31 percent of high-school dropouts likely to wind up living in poverty [source: Do Something].

Advertisement

Public education in the U.S. was long ago laid out by the government as largely the responsibility of individual states. As such, there's a pretty big disconnect between how each entity operates and funds systems and individual schools. Each state has their own specific "formula" to follow, but they all allow for the same expenses, including [source: Ohio Department of Education]:

  • instructional costs (salaries for teachers, aides, as well as materials and technology used within the classroom)
  • administration salaries (principals, vice principals, boards of education)
  • staff support (training and continued education)
  • student support outside the educational environment (guidance counseling, field trips, and psychological testing)
  • building support (maintenance, lawn care and utility bills)

It's hard, if not nearly impossible to pigeonhole averages on where and how these dollars are allocated, since each state handles education with significant difference. However, salary costs do tend to take up the lion's share of the pot, with 84 percent going to personnel salaries (for teachers and administrators) [source: Huffington Post].

Check out this basic overview to learn more about about school funding sources and how they impact the system, and children in the U.S.

Advertisement
Education Budget Breakdown

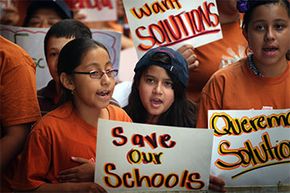
students protest in Chicago
Students and parents protested funding and staff cuts outside the office of Chicago Board of Education in 2013. Earlier that year, Chicago Public Schools announced it would close more than 50 elementary schools to rein in a $1 billion budget deficit.
Scott Olson/Getty Images

Unless you have an MBA in finance, trying to decipher how most companies and other organizations are funded is likely to leave you with a twitch in your eye, or reaching for a nice glass of wine.Although every state and school system features their own nuances, here's a basic idea of how federal, local and state tax dollars wind up in the educational coffer (using 2010 figures) [source: School Funding Fairness]:

  • 46.5 percent of educational funding comes from state revenue
  • 44.4 percent comes from local revenue
  • 9.1 percent comes from federal revenue

State: Twenty-five percent of state spending/revenue, or about $270 billion per year nationwide, is earmarked for elementary and secondary public schools. Instead of the state managing their entire educational system across the board, each farms out funds to 16,000 school systems/administrative bodies, which then dole out dollars to 100,000 schools [sources: Center on Budget and Policy Priorities, School Funding Fairness]. State income and sales taxes, along with grants and foundation payments awarded by the state are generally where these dollars come from.

Advertisement

Federal: Less than 3 percent of the federal budget directly funds primary and secondary public school systems, which during the 2010/11 school year equaled about $79 billion [source: New America Foundation].

Local: By a long shot, property taxes are the main source of local education funding (95 percent in most states), although a portion of these taxes go to other public services, like sanitation and law enforcement [source: U.S. Department of the Treasury]. Local sales and income taxes, as well as earnings on investments, and school user fees (like student activity fees) are other sources of funding [sources: Ohio Department of Education, Loeb].

To figure out how much to allot to each school, states use formulas based on how many pupils are in a district, but they may give added weight to certain variables. For example, districts might receive more money due to a having a higher percentage of special needs students or children living in poverty. On the other hand, wealthier areas will generally have better-funded schools because they have a bigger tax base [source: New America Foundation].

Advertisement

Education: The U.S. Vs. The World

korean kids
South Korea has one of the world's top-performing school systems yet spends far below the U.S. on education.
JUNG YEON-JE/AFP/Getty Images

There are huge differences between how the U.S. and other countries fund schools. The United States blows away all other budgets, spending about $12,000 per child, according to the Organization for Economic Co-operation and Development (OECD). However, looking at global math scores, the U.S. average was 481 (out of 600) in 2012, closer to the likes of Russia and Lithuania which spend far less on education, than of top-performing countries like China and South Korea [sources: Associated Press, The Telegraph].

If the U.S. spends so much on education, why are the results so poor? Education spending is hardly apples to apples. Obviously, population is a key factor – many other developed countries simply don't have the student population to educate that the U.S. does. Many students in the U.S. public schools are recent immigrants who might face language barriers; there's also a disproportionately high number of students from impoverished backgrounds in the system. Finally, the U.S. scores lower than average for the number of resilient students. These are students who perform better than would be expected when taking their socioeconomic background into consideration [source: Ryan].

Advertisement

Despite the large amount spent on funding, some basic needs are still lacking, as evidenced by the sheer amount of supplies that teachers and tax-paying parents have to buy. The current state of school facilities is sometimes questioned, with 43 percent of public school principals reporting that environmental factors, like heating/cooling issues and portable classrooms, interfere to at least some level with the education process [source: National Center for Education Statistics].

Then there is the tie between test scores and funding. The No Child Left Behind Act of 2001, for example, awards funds and grants to schools that regularly achieve standardized testing goals. Although the approach was designed to incentivize schools and teachers to improve students' reading and math abilities, critics argue that this encourages educators to "teach to the test" rather than foster comprehensive learning. (In 2012, 25 states were given waivers from the NCLB standards in exchange for agreeing to implement their own reforms).

Since improved test scores are also typically tied to salary increases, there's an incentive for teachers and administrators to raise those scores "by any means necessary." The city of Atlanta was rocked by a massive cheating scandal that involved dozens of educators who were encouraged or forced by superiors to engage in falsifying answers on student tests. Further probes indicated that other school systems across the country also experienced questionable score improvements [source: Copeland].

Advertisement

Gaining Ground, or Falling Flat?

Funding isn't the end-all-be-all of education improvements, but it certainly allows for the teachers, supplies, facilities and other necessary expenses to get the job done. While, the literacy rate of students age 15 and over is at 99 percent, 45 million U.S. adults (about 14 percent of the population) read below a 5th grade level, leaving them functionally illiterate [source: Literacy Project Foundation]. Although this is not the worst in the world, it is higher than one would expect from a first-world country.

On the plus side, racial chasms appear to be closing in educational performance. Black and Hispanic students are testing at levels eight to 25 points higher than in the 1970s, and the gender disparity is narrowing as well, with boys and girls testing more closely as revealed by the same long-term study [source: NCES]. Low-income and minority groups are also enjoying lower dropout rates, as well as increased likelihood of college enrollment [source: U.S. Department of Education].

Advertisement

Despite ongoing education and funding reform, many parents are turning to other academic options for their children. In addition to homeschooling, private education continues to be popular, and others are opting to take advantage of public school choice programs, by which students can attend a preferable school within their own system, typically one in a higher income region with better test scores, subject to space availability.

More charter schools are also popping up around the country. Although publicly funded, they are privately managed by a contract organization, and there is typically an application or lottery process for children to be enrolled, so entry is a toss-up. In 2012, about 6 percent of public schools were charter schools [source: NCES]. Although many people swear by their "leaner" approach, charter schools have actually been criticized for administration costs that are often higher than those of their public school counterparts [source: Huffington Post].

Education professionals are constantly evaluating a re-evaluating the current state of the system. Although it's unlikely that every single need will ever be met, it does appear that improvements are happening over time, even if they seem frustratingly slow on the uptake.

Advertisement

Lots More Information

Author's Note: How the Cost of Education Works

It's hard enough to balance the family budget, so I can't even imagine what it's like to allocate this kind of cash, all the while trying to please the masses and benefit the community's long-term educational prospects.

Related Articles

  • Associated Press. "U.S. education spending tops global list, study shows." CBS News. June 25, 2013. (Oct 29, 2014) http://www.cbsnews.com/news/us-education-spending-tops-global-list-study-shows/
  • Baker, Bruce D., Sciarra, David G., Farrie, Danielle. "Is School Funding Fair? A National Report Card." School Funding Fairness. (Oct. 21, 2014) http://www.schoolfundingfairness.org/National_Report_Card.pdf
  • Center on Budget and Policy Priorities. "Policy Basics: Where Do Our State Tax Dollars Go?" March 27, 2014 (Oct. 19, 2014) http://www.cbpp.org/cms/?fa=view&id=2783
  • Copeland, Larry. "School cheating scandal shakes up Atlanta." USA Today. April 14, 2013 (Oct. 19, 2014) http://www.usatoday.com/story/news/nation/2013/04/13/atlanta-school-cheatring-race/2079327/
  • Do Something. "11 Facts About Education and Poverty in America." 2014 (Oct. 21, 2014) https://www.dosomething.org/facts/11-facts-about-education-and-poverty-america
  • Huffington Post. "Charter Schools Spend More on Administration..." April 10, 2012 (Oct. 19, 2014) http://www.huffingtonpost.com/2012/04/10/charter-schools-spend-mor_n_1415995.html
  • Knakal, Robert. "Here's a List of Stupid Things the Government Spends Money On." Commercial Observer. Oct. 1, 2013 (Oct. 28, 2014) http://commercialobserver.com/2013/10/heres-a-list-of-stupid-things-the-government-spends-money-on/
  • Literacy Project Foundation. "Staggering Literacy Statistics." 2014 (Oct. 19, 2014) http://literacyprojectfoundation.org/community/statistics/
  • Loeb, Susanna. "Local revenue options for K-12 education." School Finance and California's Master Plan for Education. 2001 (Oct. 20, 2014) http://cepa.stanford.edu/content/local-revenue-options-k-12-education
  • National Center for Education Statistics. "Fast Facts." 2014 (Oct. 19, 2014) http://nces.ed.gov/fastfacts/display.asp?id=66
  • National Center for Education Statistics. "Condition of public school facilities." 2014 (Oct. 19, 2014) http://nces.ed.gov/fastfacts/display.asp?id=94
  • National Center for Education Statistics. "The Nation's Report Card: Trends in Academic Progress 2012." 2012 (Oct. 20, 2014) http://nces.ed.gov/nationsreportcard/pubs/main2012/2013456.aspx
  • New America Foundation. "Federal, State, and Local K-12 School Finance Review." April 21, 2014 (Oct. 28, 2014) http://febp.newamerica.net/background-analysis/school-finance
  • Noel, Amber, Patrick Stark, Jeremy Redford. "Parent and Family Involvement in Education." August 2012 (Oct. 19, 2014) http://nces.ed.gov/pubs2013/2013028.pdf
  • Ohio Department of Education. "Expenditure & Revenue Data." 2014 (Oct. 20, 2014) http://education.ohio.gov/Topics/Finance-and-Funding/Finance-Related-Data/Expenditure-and-Revenue/Expenditure-Revenue-Data
  • Organization for Economic Cooperation and Development (OECD). "Education at a Glance 2012" http://www.oecd.org/edu/highlights.pdf (Oct. 28, 2014)
  • Ryan, Julia. "American Schools vs. the World: Expensive, Unequal, Bad at Math." The Atlantic. Dec. 3, 2013. (Oct. 29, 2014). http://www.theatlantic.com/education/archive/2013/12/american-schools-vs-the-world-expensive-unequal-bad-at-math/281983/
  • U.S. Department of the Treasury. "State and Local Taxes." 2014 (Oct. 21, 2014) http://www.treasury.gov/resource-center/faqs/Taxes/Pages/state-local.aspx

Advertisement

Loading...