Can you tell if a stock is about to rebound?

By: Dave Roos
Should you buy or should you hold? This article might just have the information you need to make the right stock decision. See more money pictures.
iStockphoto/Thinkstock

The goal of stock market investing is deceptively simple: buy low and sell high. It's deceptive because no one — not even Warren Buffett — knows precisely when an individual stock price has hit its low point, making it the absolute best time to buy. Likewise, no one knows the exact moment when a stock price has peaked, making it the ideal time to sell.

Anybody can be a stock market genius in hindsight. From the comfort of 2013, it's easy to look back at a date like March 9, 2009, and pinpoint it as the exact moment when the Dow Jones industrial average hit the lowest point of the recession; a miserable 6,547.05, a full 54 percent lower than its previous high of 14,164.53 on Oct. 9, 2007 [source: Stark]. "This," we can say with confidence, "was the bottom of the bottom."

Advertisement

But what were investors and market analysts saying back on March 9, 2009? Thomas Nyheim, a portfolio manager at Christiana Bank & Trust Company, told CNN Money that he didn't expect stocks to rally until later that year, describing investors as being "in defensive mode. They've seen too many losses and are sitting on the sidelines" [source: Twin].

Nice try, Thomas. Less than month later, the Dow had rallied over 8,000. By July, it had topped 9,000. And by the end of 2009, the Dow was back over 10,000, a number that some doomsday analysts swore we would never witness again [source: Google Finance].

On Feb. 1, 2013, the Dow broke the 14,000 mark for the first time in more than five years [source: Cox]. If you had the uncanny foresight to buy large amounts of stock on March 9, 2009, you would be a very happy — or at least wealthy — individual. But like most people, even the "experts," you had no idea when the market was about to rebound.

Spotting a market rebound is hard enough, but today's question is downright confounding. How can you tell if an individual stock is about to rebound? The good news is that nearly the entire field of stock market analysis is devoted to this very question. The bad news ... even the smartest portfolio managers in the world still get it wrong.

Advertisement

Sector Analysis

Individual stocks do not exist in a bubble. Every publically traded stock is part of a larger financial sector. Here are some examples of market sectors and the companies that belong to them:

  • Automotive – Toyota Motor Corp (TM), Harley-Davidson Inc. (HOG)
  • Financial services – Wells Fargo & Co. (WFC), Citigroup Inc. (C)
  • Health care – Johnson & Johnson (JNJ), Pfizer Inc. (PFE)
  • Aerospace/defense – Northrop Grumman Corp (NOC), Lockheed Martin Corporation (LMT)
  • Retail services – Tractor Supply (TSCO), Staples Inc. (SPLS)
  • Internet – Google Inc. (GOOG), LinkedIn Corp (LNKD)

As a general rule, you can expect all of the stocks within the same sector to perform roughly the same [source: Abraham]. There are exceptions to this rule, of course, especially in the short term. If Nokia reports more smartphone sales than Apple, you might see a momentary bump in Nokia stock and a drop in Apple. But if you look at the bigger picture, you can expect both Nokia and Apple to follow the long-term trends in the consumer electronics sector.

Advertisement

How does sector analysis help you guess when a stock has hit its bottom and is about to rebound? If an individual stock generally tracks the performance of its sector — at least in the long term — then you can compare the performance of the stock to its sector to predict future price movements.

As a hypothetical example, let's say that Yum! Brands — which owns Pizza Hut, Taco Bell and KFC — saw its stock price drop 5 percent over the past year. In the same time period, however, the entire "leisure services" sector has grown 10 percent. Unless Yum! Brands is having some serious problems — major lawsuit, CEO in prison, employee strike — we can reasonably expect it to ride the trend of the rest of the sector.

What does that mean? It means that even though Yum! Brands is down, it's probably not down for long. In fact, a rebound might be on the horizon.

Advertisement

Compare Price to Volume

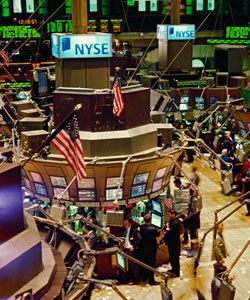
A trader works on the floor of the New York Stock Exchange.
© ANDREW BURTON/Reuters/Corbis

Share price is not the only indicator of the strength of a specific stock. When market analysts look for a stock with rebound potential, they pay particular attention to the relationship between stock price and trading volume.

First, let's define volume. Volume is a simple measurement of how many shares of stock changed hands during a single day of trading. It's important to note that each share has both a buyer and a seller. If a company's trading volume goes way up or down on a particular day, that's a good indication that investor interest in the stock is changing. If we throw stock price into the mix, we can start looking for signs of a rebound.

Advertisement

Here's how it works. If a stock's share price goes down, but trading volume is relatively low, that's called a weak move [source: Mitchell]. In other words, if volume is low, then investor interest is low, which isn't a strong indicator of a rebound. You need a lot of interested buyers to drive a stock price up; it's the law of supply and demand. The more demand for a stock, the more money investors are willing to pay for it.

If you are trying to predict a rebound, first you want to look for a sustained period of declining share price and a similar decline in volume. Then, just as trading volume tapers off, you want to look for a day — or an hour, or a minute! — in which the stock's share price still declines slightly, but there's a spike in trading volume. This is a sign that the last sellers are finally out of the market and buyers are now taking over [source: Mitchell]. If the buying trend continues, the stock price will rebound and you will have gotten in on the bottom floor.

Of course, you want to make sure the company itself is financially sound so that you don't end up with a bunch of worthless stock.

Stock analysts have developed a number of useful formulas for tracking this critical relationship between volume and share price. If you are serious about trading stocks, you should learn more about indicators like on-balance volume, Chaikin money flow and the Klinger volume oscillator.

Advertisement

Lots More Information

Author's Note: Can you tell if a stock is about to rebound?

In its purest and somewhat sentimental form, an investment in the stock market is a vote of confidence for the future performance of a company or industry. If I buy shares of stock in General Motors, it means that I believe that GM will continue to innovate and outsell the competition. When the Dow Jones goes up, we generally equate that with growing confidence in the American economy. But how much does stock price and investment trends have to do with the actual financial performance of American businesses? And how much can be attributed to sophisticated traders using any number of mathematical algorithms and inscrutable techniques to "game" the system? If you want to take a somewhat disturbing look at the reality of modern stock trading, look up information about high-frequency trading or "robo-trading," which accounts for at least half of all the daily trading volume on the New York Stock Exchange.

Related Articles

  • Abraham, Stephan. "3 Ways to Tell If Your Stock Has Bottomed." Investopedia. Dec. 17, 2010 (April 26, 2013) http://www.investopedia.com/articles/basics/10/3-ways-tell-stock-bottom.asp
  • Cox, Jeff. "Dow Breaks 14,000 Finally; What's Next for Market?" CNBC. Feb. 1, 2013 (April 26, 2013) http://www.cnbc.com/id/100416162
  • Cramer, Jim. "Cramer on Spotting a Stock's Bottom." CNBC. Feb. 14, 2013 (April 26, 2013) http://video.cnbc.com/gallery/?video=3000147989
  • Google Finance. "Dow Jones Industrial Average" https://www.google.com/finance?q=INDEXDJX:.DJI
  • Mitchell, Cory. "How to Use Volume to Improve Your Trading." Investopedia. May 16, 2011 (April 26, 2013) http://www.investopedia.com/articles/technical/02/010702.asp
  • Stark, Betsy. "Tracking the Dow One Year After Rock Bottom". ABC News. March 9, 2010. ((April 26, 2013) .http://abcnews.go.com/Business/year-ago-today-dow-hit-bottom-recession/story?id=10046578#.UYfgpsqzeSp
  • Twin, Alexandra. "For Dow, another 12-year low." CNN Money. March 9, 2009 (April 26, 2013) http://money.cnn.com/2009/03/09/markets/markets_newyork/

Advertisement

Loading...