Why the U.S. Monthly Jobs Report Matters

By: Dave Roos
job fair at the Seminole Hard Rock Casino
Seminole Hard Rock Casino department supervisors speak with a job applicant during a job fair at the Seminole Hard Rock Casino May 25, 2021, in Tampa, Florida. Octavio Jones/Getty Images

The first Friday of every month is circled in red marker on the calendars of every economics geek, policy wonk and business journalist in America. Informally known as "jobs day," this is the day that the Bureau of Labor Statistics (BLS) releases its monthly Employment Situation Summary, a.k.a "the jobs report," at precisely 8:30 a.m.

The jobs report makes headlines every month because it's such an effective measure of the health of the U.S. labor market. In the report, which looks back at the previous month, the BLS updates key stats like the unemployment rate, how many jobs were added (or lost) during the month, and whether wages and earnings went up or down on average.

Advertisement

Economists, media outlets and politicians trip over themselves to comment on the jobs report because its facts and figures are a good indication of whether America's economic policies are working. The numbers in the jobs report can influence how the Federal Reserve conducts monetary policy and whether Congress approves extensions for federal unemployment benefits.

Since the jobs report is so important and such a recurring feature of the news cycle, it's probably time that you understood what the heck it is. We reached out to Elise Gould, senior economist at the Economic Policy Institute and an avid reader of the monthly jobs report, for some answers.

Advertisement
One Report, Two Surveys

The jobs report publishes data from two large and completely separate surveys.

The first survey, called the "establishment survey," is aimed at businesses. For that survey, the BLS contacts about 144,000 businesses (excluding agriculture) and government agencies and asks them detailed questions about how many workers they employ and how much those workers were paid.

Advertisement

The establishment survey is what delivers the "non-farm payroll" number. "That's the big number that people talk about," says Gould, "how many jobs were added that month."

The second big survey, conducted jointly by the BLS and the U.S. Census Bureau, is the "household survey." For this survey, 60,000 individual American households are asked dozens of questions about the employment status of family members 16 and older.

"The household survey is a survey of people as opposed to businesses," says Gould, and that's where the BLS gets the unemployment rate. "You need a household survey to calculate the unemployment rate, because if you're only asking employers, then you don't know who's not working."

Advertisement

Who Counts as Unemployed?

That's a deceptively complicated question.

First, it's important to note that the household survey technically collects data from just one week out of the month, says Gould, typically whatever week contains the 12th. So, an individual's employment status for the month depends on what they did that one week.

Advertisement

The BLS assigns one of three statuses to each member of the household 16 or older: employed, unemployed or out of the labor force:

  • You're considered employed if you did any work as a paid employee during the reference week; if you worked for your own business or farm; or did at least 15 hours of unpaid labor in a family business or farm. You're also considered employed if you were temporarily absent from work because of illness, bad weather, vacation, etc.
  • You're considered unemployed if (and only if) you meet all three of these criteria: you had no employment at all that week; you were available to work (but didn't); and you made efforts to look for work for the entire four-week period ending in the reference week.
  • You are considered out of the labor force if you are not working but don't qualify as unemployed. Examples of people out of the labor force include full-time students, stay-at-home parents, unpaid caregivers, retirees, but also people who have actively stopped looking for work for various reasons.

Gould explains that the unemployment rate published every month in the jobs report is a percentage. It's not the percentage of all working-age adults who are out of work, but the percentage of the labor force that is out of work. People considered "out of the labor force" aren't counted. The equation looks like this:

Unemployment Rate = Number of Unemployed People รท (Employed + Unemployed People) X 100

That is an important distinction when looking at the unemployment rate and how it changes from month to month. There is both a numerator and a denominator to consider, says Gould, and both can change. For example, the unemployment rate can go up because: a) more people lost their jobs, or b) more people started looking for jobs (adding to the labor force).

In the second scenario, says Gould, a higher unemployment rate is actually a positive sign.

"In that case, I'd say the unemployment rate rose for the right reasons, because more people came into the labor force looking for a job," explains Gould. "That means that they're optimistic about their opportunities, which is great news."

Advertisement

Beyond the Big Numbers

For data geeks like Gould, the real fun of the jobs report is digging into all the other figures included in the monthly report, not just the headline-grabbing unemployment rate and non-farm payroll numbers.

The establishment survey, for example, drills down to include job figures for specific industries like leisure and hospitality, financial activities, or research and development. The big non-farm payroll figure is a net calculation, says Gould, meaning that some industries may add jobs, while others lose them. Breaking down the employment and wage numbers by industry is a more useful indicator of how the economy is performing for different types of businesses.

Advertisement

The same thing is true of the household survey, which collects demographic data about everyone it surveys. That makes it possible to break down the unemployment figures by race, gender, education level, geographic region, by how long people have been out of work, and more. Again, this paints a much more accurate picture of how well or how poorly different types of workers are faring in the economy.

Politics and the Jobs Report

Politicians are famous for spinning the jobs report to make themselves and their policies look good, usually by cherry-picking isolated data points that seem positive. For example, during the pandemic, some politicians and economists pointed to a steady growth in nominal wages (wages unadjusted for inflation) as a sign of recovery. But how could wages be up in 2020 when so many people were out of work?

Jen Psaki, press conference
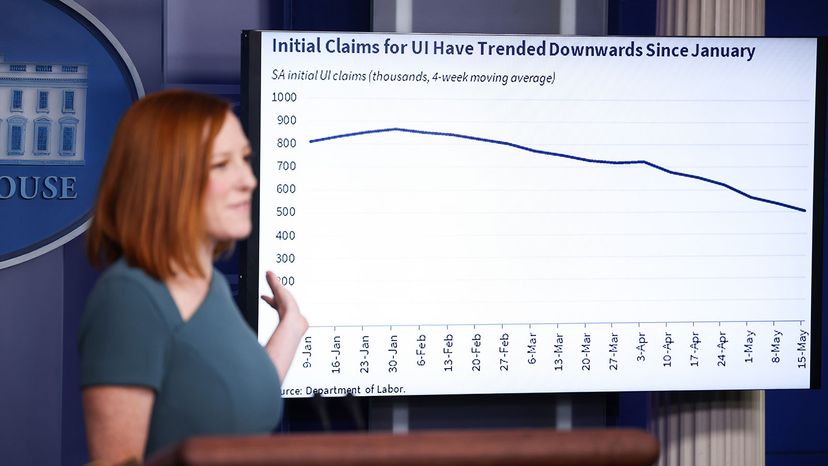
White House Press Secretary Jen Psaki gestures to a chart showing the rate of unemployment insurance claims during a press conference at the White House May 20, 2021, in Washington, D.C. Psaki spoke on the latest U.S. jobless claims report.
Anna Moneymaker/Getty Images

"It was because so many low wage workers lost their jobs," says Gould. "When you pull out the bottom of the labor market, the average is going to be higher because you're missing all of these low-wage workers. Taking that out of context would be an improper use of the data."

Advertisement

When the April 2021 jobs report (which came out in May 2021) showed lower-than-expected growth, some business owners, the U.S. Chamber of Commerce and many Republicans were quick to blame the expanded unemployment benefits offered under the Biden Administration for why people were not out looking for work. Others said the real reasons for the sluggish numbers were the lack of child care options for workers during a time when schools were closed and the low wages being offered for positions that involved dealing with the public and exposing themselves to the coronavirus. However, the end of extended federal unemployment benefits in September did not lead to a big hiring increase.

The November 2021 jobs report, which came out in December, showed the U.S. economy had added just 210,000 jobs, when economists had expected more than 500,000 jobs, The Wall Street Journal reported. However, the report also showed that almost 600,000 people joined the workforce as employers started offering higher wages to entice workers back.

Advertisement

Advertisement

Loading...