How Inflation Works

By: Dave Roos  | 
money in a vortex, illustration
People know inflation has something to do with the rising cost of living even if they're not exactly sure what it is. PM Images/Getty Images

If you got married in America in 1967, you could expect to buy your first home for $22,500, your first new car for around $3,000 and a Friday night date at the movies would run you a dollar for each ticket and an extra nickel for popcorn [sources: DQYDJ, Bruffey, National Association of Theater Owners].

Those were the "good old days," or at least that's what baby boomers try to tell you. What they fail to mention is that the richest guy on the block in 1967 made $19,000 a year, or that 60 percent of American households earned less than $8,300 a year [source: U.S. Census]. Suddenly, a dollar for a movie ticket doesn't sound so cheap.

Advertisement

In 2019, the 60th percentile of U.S. household income was $50,010, more than six times as much as 1967. The average price of a new car in the U.S. in 2019 was more than $36,000, about 12 times as much as 1967. And the average price of a movie ticket in 2019 was $9.16 — a nine-fold increase [source: National Association of Theater Owners]. Why have prices and incomes increased from 1967 to 2019? It's called inflation.

Inflation is the economic term for a persistent rise in prices over time. To get technical, inflation is not so much about an increase in prices, but the decrease in the buying power of the dollar. A dollar in 1967 bought you a movie ticket, while the same dollar in 2019 bought you one-ninth of a movie ticket.

Inflation is measured in percentage change from year to year. Since 1992, the U.S. rate of inflation has fluctuated between -2.1 percent and 5.4 percent [source: US Inflation Calculator]. If inflation rose 3 percent from 1995 to 1996, a stick of gum that cost $1 in 1995 would cost $1.03 in 1996. An extra three pennies won't break the bank, but in the late 1970s and early 1980s, the U.S. experienced inflation as high as 13.5 percent. That was enough to make everyday commodities like food and gasoline nearly unaffordable.

It's one thing to know what inflation is — rising prices, or the lower buying power of the dollar — but another thing entirely to understand what causes it. Complicated economic theories abound, but we'll simplify the leading contenders on the next page.

What Causes Inflation?

Prices don't just rise on their own, so what are the underlying forces that slowly erode the buying power of the dollar or any other currency?

The most common explanation for inflation is based on the free market principle of supply and demand. In a free and open market, if the demand for a product is greater than the supply, the price of that product tends to go up. If supply is greater than demand, then prices go down. To put it another way, when there's too much product on the market, each unit loses value.

Advertisement

The same principle is true for money. If there is too much money in circulation — both cash and credit — then the value of each individual dollar decreases. This explanation of inflation is called the demand-pull theory and is classically defined as "too much money chasing too few goods."

But how can there be too much money in circulation? For that answer, you need to understand how the Fed works. The Fed, formally known as the Federal Reserve, is the "bank of the banks," and the gatekeeper of the U.S. money supply. The Fed uses its monetary policy to influence the amount of money held in banks and the interest rates at which that money is lent to people and businesses. We'll talk more about monetary policy in a few pages.

The second explanation for the cause of inflation is the cost-push theory, which states that increases in the costs of raw materials and labor drives up the prices of goods and services. Bread is a good example. When the price of wheat goes up, the price of flour goes up, which makes the cost of bread rise (pun intended).

But do increases in the price of individual products really cause inflation? Many economists say no. For example, demand for bread increases but the baker does not immediately increase his prices. Instead he depletes his stock of flour first. If increased demand continues, he'll buy more flour from his supplier, who will in turn buy more wheat from his farmer. Imagine that his fellow bakers are experiencing similar demand. Since all the suppliers want more flour, they'll offer the farmer more money for his wheat, which will cause the price to go up on wheat, flour, and eventually, on bread. So even though it seems like the higher cost of raw materials is responsible for the higher cost of the final item, it was actually the aggregate demand for the final product that caused the price to go up [source: Batten].

Changes in the relative prices of individual products do not mean inflation has taken place. Inflation is defined as a "persistent" rise in the overall level of prices of all goods and services [source: Batten]. So, even a serious spike in gasoline prices — as experienced during the OPEC embargo of the 1970s — isn't the root cause of inflation.

Economist Milton Friedman famously said, "Inflation is always and everywhere a monetary phenomenon," meaning that money supply, not the rising cost of doing business, is the primary cause of inflation.

How Is Inflation Measured?

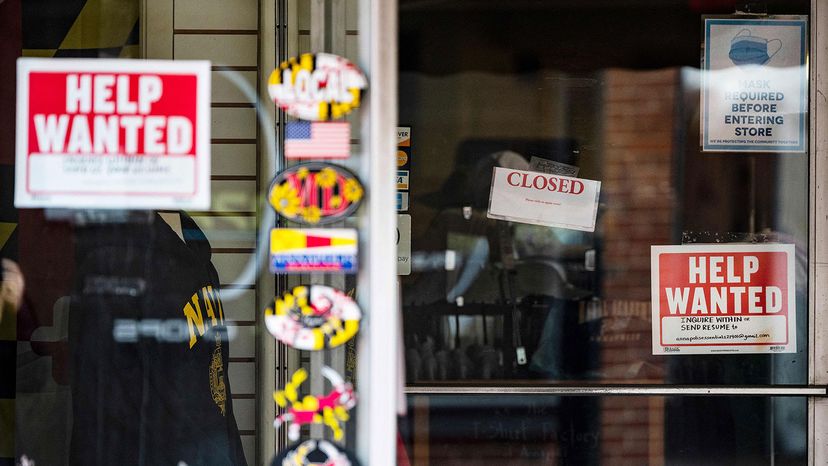
help wanted signs in store
A store posts a Help Wanted sign in Annapolis, Maryland, on May 12, 2021. U.S. consumer inflation surged 4.2 percent last month compared to April 2020, the Labor Department said, posting the biggest year-on-year increase since 2008 as the economy recovered from the pandemic. JIM WATSON/AFP via Getty Images

This part of the story is kind of amazing. Since inflation is a measurement of the rise in the average price of all goods and services in the economy, somebody has to actually go out and collect all of that data. In the United States, that falls to the Bureau of Labor Statistics (BLS), and the result of this massive data collection effort is called the Consumer Price Index (CPI).

The CPI is based on the price of something called the CPI "market basket." Imagine a shopping basket that includes every item in more than 200 categories of consumer products or services under eight major groups: food, housing, apparel, transportation, medical care, recreation, education and communication and "other" [source: BLS]. That's the CPI market basket.

Advertisement

Every two years, the BLS interviews 24,000 American families on what they actually bought to determine the specific items to include in the market basket. Another 12,000 families keep diaries on their spending habits. Every month, the BLS employs teams of "economic assistants" to record the prices of 80,000 different items on store shelves [source: BLS].

Once the BLS has determined the price changes, it calculates the average overall increase and reports it as the CPI. The CPI is an index, not a dollar figure. The index is based on price levels set back in the early 1980s. Those baseline figures are set at CPI = 100. When the CPI reached 200 in April 2006, that signified a 100 percent increase in overall prices from the early 1980s. Usually the 100 percent would trigger a reset of the BLS base year, but as of 2021, it has not happened.

To calculate the annual rate of inflation for 2020, the BLS subtracted the average 2019 CPI (249.222) from the average 2020 CPI (252.248) and then divided that difference (3.026) by the average 2019 CPI to get a percentage increase of 1.2 percent [source: BLS].

The percentage of CPI increase is the number that is typically reported as inflation, but it's not the only measurement. The Fed prefers to focus on what it calls "core inflation," which is the CPI minus the more volatile categories of food and energy [source: Appelbaum]. The BLS also produces the Producer Price Index, which measures inflation earlier in the production cycle, and the Employment Cost Index, which measures inflation in the labor market.

Some economists and politicians ditch all of these indicators for their own inflation formulas, usually to prove a point about the brilliance or ineptitude of Fed monetary policy.

The Danger of Inflation and How to Control It

Inflation can hurt people and the broader economy in a number of ways:

  • Investments lose value. If you invest in a CD with a yield of 4 percent, but inflation rises at 3 percent, then your return in "real dollars" is only 1 percent.
  • Lenders raise interest rates. If a bank expects inflation to rise, it will charge a higher interest rate on its loans to make up for the loss in dollar value.
  • Fixed incomes erode. If you receive a pension or other fixed annuity in retirement, the payments may not increase with inflation. Social Security payments, however, automatically rise with the latest CPI figures.
  • Businesses have a hard time planning for the future. When the rate of inflation is uncertain, manufacturers and retailers have a hard time determining the future cost of materials and labor. This discourages investment and economic growth [source: New York Fed].

In rare and serious financial crises, hyperinflation can set in. In the Weimar Republic of Germany, the mark exploded from 2,000 marks to the U.S. dollar in December 1922 to 4.2 trillion marks to the dollar in November 1923 [source: Jung]! Similar cases of hyperinflation struck China in the 1950s, Argentina in the 1980s, and Brazil in the 1990s, causing massive financial losses and social unrest [source: New York Fed].

Advertisement

After the U.S. experienced double-digit inflation in the late 1970s and early 1980s, the Fed took a more assertive role in controlling inflation through monetary policy. If economic growth is slow, the Fed tries to stimulate the economy by injecting more cash and credit into circulation. Contrary to popular belief, the Fed doesn't "print money" [source: Task]. Instead, the Fed influences the money supply in three major ways:

  • The Fed buys from or sells bonds to banks, paying them cash for securities. Buying bonds increases the money supply; selling decreases it.
  • The Fed lowers the reserve requirement, the percentage of customer deposits that banks cannot lend out to other people. The lower the requirement, the more money can be in circulation.
  • The Fed lowers its discount rate, the rate it charges banks for short-term cash loans. When banks pay less for a loan, they can turn around and lend the money at a lower rate. Lower rates encourage businesses and people to take out more loans, adding money to the economy [source: New York Fed].

Lots More Information

Author's Note: How Inflation Works

If you are 30 or older — like some of us — then you have caught yourself saying things like, "A gallon of gas is almost $4? I remember when it was $1.25!" I call these grandpa (or grandma) moments. In our exasperation, we fail to account for the long-term effects of inflation. And in our refusal to acknowledge that we are indeed getting old, we forget that two decades have passed since gas prices were that low, or that $1.25 didn't feel particularly cheap back in 1993. What I'd like to know is the exact age at which we psychologically imprint prices. We use this internal reference point to compare prices for the rest of our lives. Maybe it's the year that you first start paying for things yourself, like gas. Or the first time you get a paycheck and realize the true value of money. Soon enough, we all have our first grandpa moment.

Related Articles

  • Appelbaum, Binyamin. "Inflation Deflation." The New York Times. April 15, 2012. (March 21, 2013) http://economix.blogs.nytimes.com/2012/08/15/inflation-deflation/
  • Batten, Dallas S. "Inflation: The Cost-Push Myth." St. Louis Fed. June/July 1981. (March 21, 2013) http://research.stlouisfed.org/publications/review/81/06/Inflation_Jun_Jul1981.pdf
  • Board of Governors of the Federal Reserve System. "How will the Federal Reserve ensure that the size of its balance sheet won't lead to excessive inflation?" April 27, 2011. http://www.federalreserve.gov/faqs/money_12852.htm
  • Bureau of Labor Statistics. "Consumer Price Index." March 15, 2013. (March 21, 2013) ftp://ftp.bls.gov/pub/special.requests/cpi/cpiai.txt
  • Bureau of Labor Statistics. "Consumer Price Index: Frequently Asked Questions." (May 21, 2021)https://www.bls.gov/cpi/questions-and-answers.htm#Question_2
  • Federal Reserve Bank of New York. "The Story of Monetary Policy." (March 21, 2013) https://www.polk.k12.ga.us/userfiles/909/Classes/177525/the%20story%20of%20monetary%20policy%20comic.pdf?id=242739
  • Goodman, George J.W. "Paper Money." Summit Books, February 1981. (March 21, 2013) http://www.pbs.org/wgbh/commandingheights/shared/minitext/ess_germanhyperinflation.html
  • Jung, Alexander. "Millions, Billions, Trillions: Germany in the Era of Hyperinflation." Speigel. Aug. 14, 2009. http://www.spiegel.de/international/germany/millions-billions-trillions-germany-in-the-era-of-hyperinflation-a-641758.html
  • National Association of Theater Owners. "Average U.S. Ticket Prices." (March 21, 2013) http://www.natoonline.org/statisticstickets.htm
  • Spicer, Jonathan. "In historic shift, Fed sets inflation target." Jan. 25, 2012. (March 21, 2013) http://www.reuters.com/article/2012/01/25/us-usa-fed-inflation-target-idUSTRE80O25C20120125
  • Task, Aaron. "No, the Fed Does NOT 'Print Money.'" Yahoo! Finance. Jan. 24, 2012. (March 21, 2013) http://finance.yahoo.com/blogs/daily-ticker/no-fed-does-not-print-money-just-explain-150433185.html
  • U.S. Census. "Historical Income Tables: Household." (May 18, 2021) https://www.census.gov/data/tables/time-series/demo/income-poverty/historical-income-households.html
  • U.S. Census. "Median and Average Sales Prices of New Homes Sold in the United States." (March 21, 2013) http://www.census.gov/const/uspricemon.pdf
  • U.S. Department of Energy. "Fact #219: Average Price of a New Car, 1970 to 2001." June 3, 2002. (March 21, 2013) http://www1.eere.energy.gov/vehiclesandfuels/facts/favorites/fcvt_fotw219.html
  • Vlasic, Bill; Bunkley, Nick. "A Bad Year for Car Bargains." The New York Times. May 20, 2011. (March 21, 2013) http://www.nytimes.com/2011/05/21/business/21auto.html